Typical July for bitcoin.
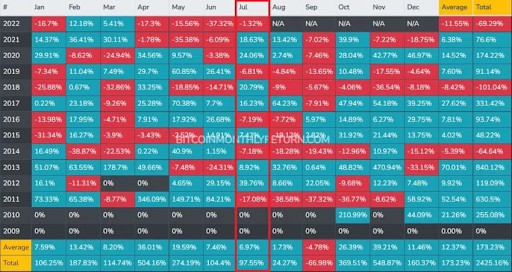
The history of movement shows that July is not usually the best month for bitcoin. Over the past 11 years, BTC has demonstrated negative movement dynamics during the indicated time frame 4 times. However, bitcoin losses in June are usually not critical. Here is how the statistics of BTC movement in this month looks like in percentage terms:
- Decrease - 36%
- Growth - 64%
How bitcoin price has changed by month.

A bitcoin forecast for July 2022 would not be complete without analyzing BTC movement opportunities through the lens of the impact of halving on the cryptocurrency's behavior. As a reminder, the last decline in coin production rates was recorded in May 2020.
Bitcoin's halvings form a shortage of BTC on the market, which, amid growing demand for the cryptocurrency, as history shows, leads to an increase in its exchange rate. At the same time, the coin's transition to the positive movement phase is usually preceded by crypto winter and drop of bitcoin rate.
To understand what July 2022 could be for bitcoin, we need to determine which phase BTC is in, relative to halving. This will require analyzing the cryptocurrency's behavior over a similar July 2022 timeframe after previous halving of the coin's mining speed.
Halving-adjusted bitcoin forecast for July.
The last BTC halving was recorded on May 11, 2020. The period from July 1 to July 31, 2022 is the gap from 781 to 812 days after the bitcoin mining slowdown. The start of the segment is on day 233 after BTC updated its all-time high at $68,789 on November 10, 2021.
The 2020 Halving was preceded by two others: November 28, 2012 and July 9, 2016. To figure out how the coin might behave in June 2022, we need to examine the coin's movements between days 781 and 812 after the 2012 and 2016 halvings. Here's what the basic calculations look like:
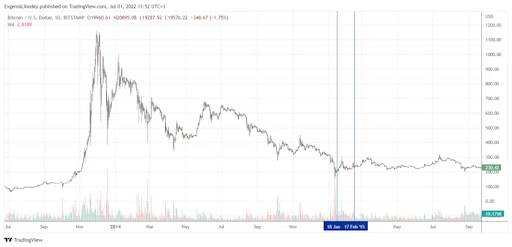
- Halving 2012. The period from day 781 to day 812 came between January 18, 2015 and February 18, 2015.
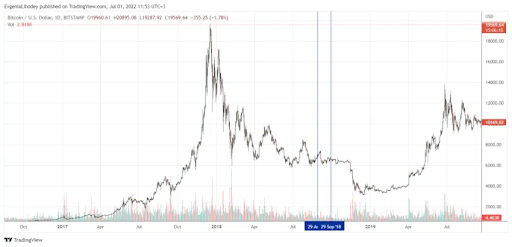
- Halving 2016. The period from 781 to 812 days fell in the interval August 29, 2018 - September 29, 2018.
Let's start with bitcoin's movement from day 781 to day 812 after the 2012 Halving. BTC spent this time period in sideways movement. It started on day 409, after bitcoin updated its local high at the end of November 2013 near the $1100 level. After the gap ended, BTC continued to move sideways for several months.

The period from day 781 to day 812 after the 2016 Halving, bitcoin began with a burst of growth that turned sideways. The breakout began on day 258 after bitcoin updated its local high in December 2017 near the $20K level.
More than a month after the end of the breakout, BTC went into active decline. As a result, the coin has fallen in price by half from the values recorded in the period from 781 to 812 days after the halving of 2016.

Based on the date of fixing local cycle highs, the movement of BTC in 2022 is closer to the scenario that set the halving of 2016. Therefore, we can assume that July 2022 is unlikely to be a month of global trend change for bitcoin. Most likely, BTC will spend the month in sideways movement. At the same time, bitcoin's forecast for July does not exclude a descent to new local lows.
In lieu of conclusions.
Analysis of bitcoin's movements between days 781 and 812 after the 2012 and 2016 halvings suggests that the cryptocurrency could spend July 2022 in sideways movement. At the same time, it is possible that this period of time will be a barrier to the renewal of cyclical lows of BTC. If you want to buy some Bitcoin, read this article about how to buy and sell BTC anonymously.


